Appendix A - Network Emulation Details and Validation
Netem is used to emulate the properties of a wide area networks such as delay, bandwidth restrictions and packet loss. The code is available in recent Linux kernels, version 2.6 and higher will suffice. Netem was used to implement network delay (e.g. 10ms latency) on a laboratory PC running Fedora Core 4 Linux distribution with 100Mbps LAN ports.
To restrict bandwidth, Quality of Service (QoS) controls were implemented using the hierarchical token bucket. Extensive documentation is available on the web at the following locations:
- http://linux-net.osdl.org/index.php/Netem - the netem wiki
- http://lartc.org/howto/lartc.qdisc.html - Linux advanced routing
- http://luxik.cdi.cz/~devik/qos/htb/ - HTB home page
Both capabilities are invoked using the ‘tc’ utility included in the iproute2 package. Only outgoing packets on an interface are affected, which is an important note. To emulate a WAN link, QoS must be applied to both interfaces. (e.g. Asymmetrical DSL line)
<>The emulator was configured as a bridge to eliminate the need for changing IP addresses on the client. Queuing parameters were applied to both interfaces (eth1 and eth0) to shape both incoming and outgoing traffic. Eth0 is the upstream interface, which is connected to the wide area network. Eth1 is the down stream interface, which is connected to the client.Commands:
# Set up Ethernet 1
tc qdisc del dev eth1 root
# Use netem to implement packet delay
tc qdisc add dev eth1 root handle 1: netem delay 16ms
# Now, set up the bandwidth limits
tc qdisc add dev eth1 parent 1:  handle 10: htb deault 1
tc class add dev eth1 parent  10: classid 10:1 htb rate 768kbit ceil 768kbit
# Do the same thing for Ethernet 0
tc qdisc del dev eth0 root
tc qdisc add dev eth0 root handle 1: netem delay 16ms
tc qdisc add dev eth0 parent 1:  handle 10: htb deault 1
tc class add dev eth0 parent  10: classid 10:1 htb rate 128kbit ceil 128kbit
trpr – Trace Plot Real-Time
<>This program calculates flow rates using tcpdump capture files and outputs the results to a file suitable for graphing using gnuplot. Trpr was written by the Navel Research Laboratory.Collect data using tcpdump, then calculate the rates with trpr and display the results with gnuplot. Trpr requires the hex output. When working with a slower computer, two steps are needed. Capture the binary data, then write the hex file for trpr.
tcpdump –l –n –w /tmp/test.dmp
tcpdump –n –x host 192.168.10.102 –r /tmp/test.dmp | trpr \
auto X output /tmp/plot.plt
gnuplot–persist /tmp/plot.plt
Several experiments were run to validate the performance of the emulator. The tests are by no means exhaustive, but they do show the emulator performs as expected. Here is the result of an iperf (bandwidth test) session over a 100Mbps LAN link, using two Pentium 400s with the Linux OS. The plot was produced using the tools described above; tcpdump, trpr and gnuplot. The transfer rate is about 80 Mbps.
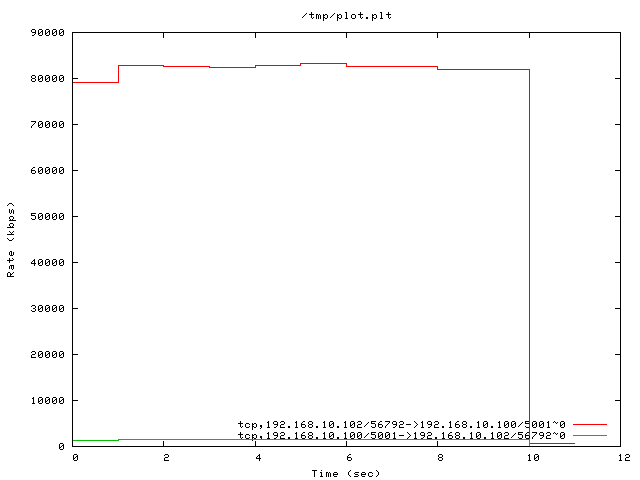
No emulator – 100MBps Local Area Network
Next, two plots are made with the simulator between the sending and receiving station. The first plot shows the results of setting the emulator at 128Kbps (in/out) and the second plot shows the results for a T1 (1.54Mbps). The latency was 80ms.
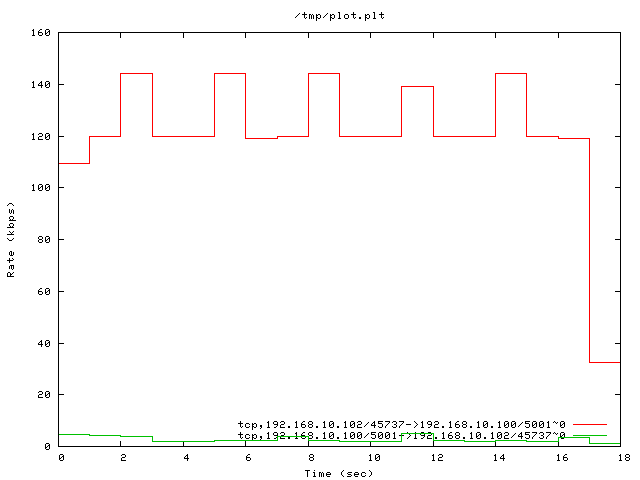
Emulator set for 128Kbps bandwidth and 80ms latency (Note the ‘picket fence’ effect is a result of the data averaging resolution in trpr.)
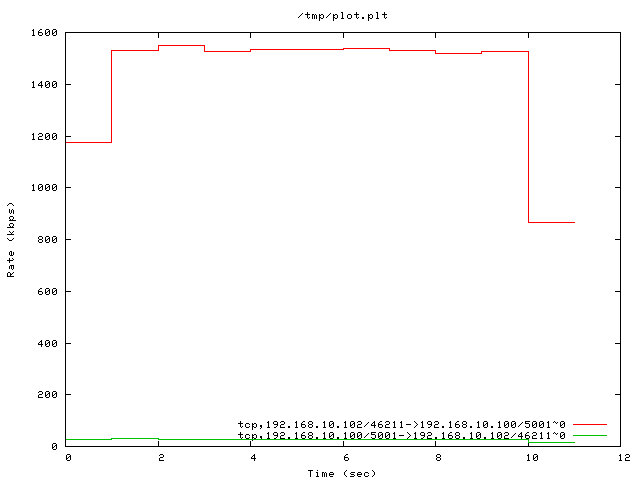
Emulator set for T1 (1.544Mbps) bandwidth and 80ms latency
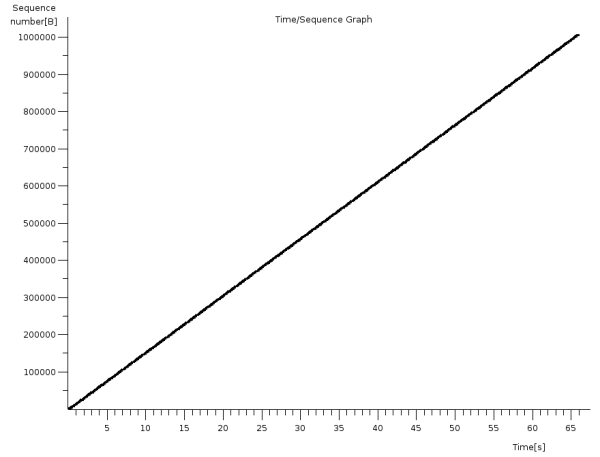
Time/Sequence graph for a 128kbps, 60 second connection through the emulator – produced by Ethereal. This shows a smooth data transition, with no interruptions.
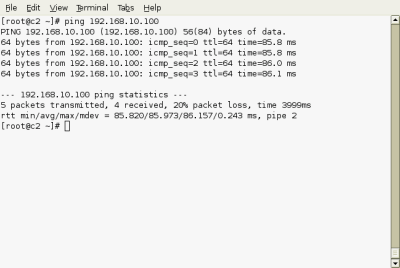
Screen capture showing the results of setting the emulator to 80ms latency. Note the additional 5ms and see the Spirent tests in Appendix B.